Information from sales data is often insufficiently taken into account to make production more efficient and effective. As a result, opportunities are missed! This is partly because we often look at sales information too simplistically.
For example, consider the following two expectations:
-
We expect total product A sales of 5,000 Storage Keeping Units (SKU) next month.
-
We expect an 800 SKU order every Monday next month and 1 order in between of 1,800 SKU.
The second forecast provides much more clues for planning production capacity and optimizing inventory than the first. Good information on expected (forecast) and planned (demand) sales is therefore very valuable for production planning.
Many times sales data is aggregated to a higher level so that it is easier to interpret. But to effectively use sales data for production planning, additional depth is needed. The right depth turns sales data into relevant information for better planning.
In this piece, we discuss 3 ways you can get more out of your sales data.
-
Grouping sales data
-
Optimizing inventory versus production
-
Creating a production schedule
In doing so, we start at a high level of aggregation and dive into more and more detail.
Grouping to better plan work capacity and resources
Statistics at the aggregate level, such as how many sales we have of product A, can certainly be interesting. But added value at this level arises mainly when we can group products by relevant characteristics. For example, how many products will we sell that all require the same machine adjustments? Or how many sales do we expect from products based on the same raw materials? The better you can group on such characteristics, the more certain you can be of the values that come out of it. For example, suppose you expect to sell 50 units of product A1 or 30 units of product A2, and both use the same raw materials. Then it is fairly certain that you will need the common raw materials, and so you can stock these in advance.
Practically, you can think like this: what is the probability of X sales of each item? You can then add these numbers together. This way you arrive at an expected value, which if you can group several smaller products will lead to a reasonably reliable result. Note that if you can’t group for some products, those products will always fall between the cracks. If you have a 50% chance of selling 10 and you have commodities for 5, you will always have too much if nothing sells and too little when you do sell. Whether you prefer to be on the safe side (higher in inventory and working capacity) or lower is a trade-off here that only you can make for yourself.
Effectively handling what comes in stock
When we look at inventory optimization, it refers to several aspects of the production process. How much raw material do you keep in stock, how much semi-finished product is in stock (if relevant) and how many finished products?
For inventory issues, the total numbers sold per product can be looked at at the product level. However, one dimension that is often omitted from this is with what probability and frequency the sales occur. One often looks at it as follows; of Product A, we sold 50 SKU in September. More clues can arise when it is known that this consists of 10 orders of 5 sales. This is because there is a significant difference between 10 sales of 5 SKU or 1 sale of 50 SKU. After all, you cannot make the latter sale with 30 SKU in stock. But with this inventory, the first 6 sales of 5 SKU can be delivered. This is an area that is often not looked at in sales data, but that is totally unjustified!
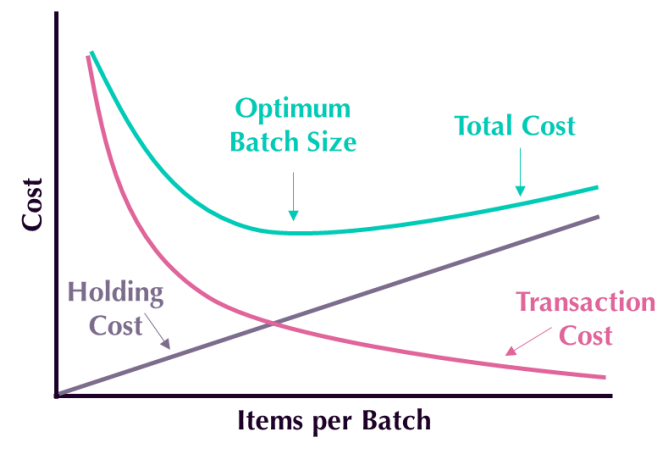
In fact, when optimizing batch sizes, U-curve optimization (The Principles of Product Development Flow 2009, Donald G. Reinertsen) applies. Determining the optimal batch size is actually a trade-off between start-up costs and inventory costs. For comparison, think of buying eggs at the supermarket. If you get 1 egg each time and want to make an egg daily, you will have to go back and forth to the supermarket often. However, if you get 365 eggs in 1x then you are stuck with a house full of eggs that need to be refrigerated. You only have to go to the supermarket once a year which saves time and fuel, but you need extra space in your house, a refrigerator and extra energy. So both approaches are not optimal. So you want to be somewhere in the middle(link to youtube).
In U-curve optimization, start-up costs (transaction cost) are presented as inversely proportional (one-time cost/number of SKUs) and inventory costs (holding cost) are seen as proportionally presented (each SKU costs something in inventory). The example graph shows that an optimum batch size can be calculated.